The Activity Report
The activity report furnishes comprehensive details regarding the usage and adoption of your Stack Automation account.
Here are examples of insights obtainable from this report:
- Trend in deployment launches
- Trend in active users (Note: A user is deemed active if they have started at least one deployment within the defined timeframe)
- Holistic view of deployment statuses, including those requiring immediate attention
- Segmentation of deployments based on space and blueprint
- Identification of the most active users
- Evaluation of the most and least used blueprints
- Assessment of deployments running for the longest durations
Let's examine a real-life application of the activity report:
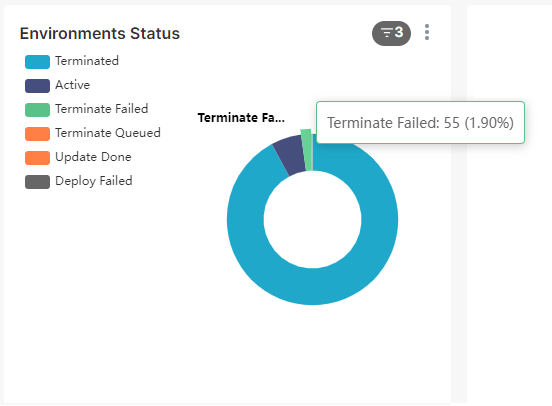
Observing the "Deployment Status" chart, we note that there are presently five deployments (1.9% of the total deployments) for which termination failed. Since their cloud resources may still be operational and consuming cloud budget, investigating this matter is advisable. If we cross-filter by these deployments, the report will show only deployments that failed to terminate.
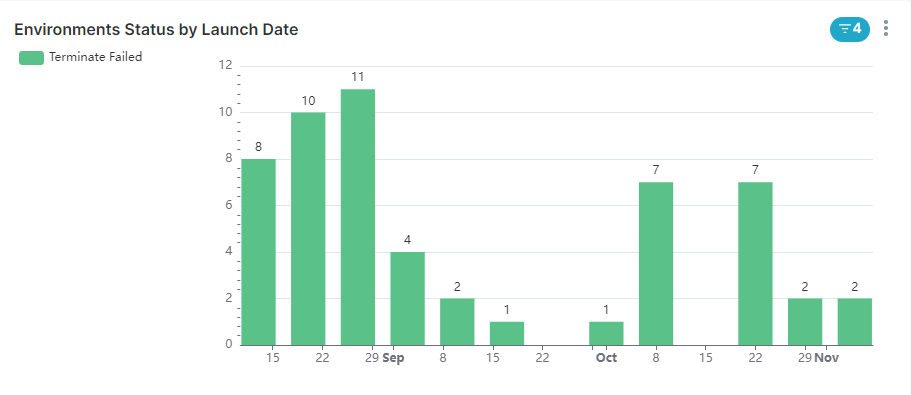
We can discern the launch dates of these deployments:
Additionally, we can identify the spaces where these deployments were launched:
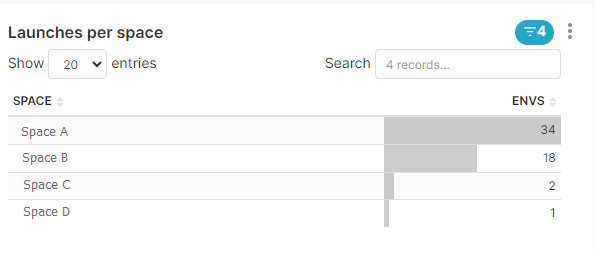
As well as who launched it, and from what blueprints.
This data enables us to identify anomalies or issues in specific spaces, users, or blueprints. For instance, if a substantial number of deployments which failed to terminate were launched from a single blueprint, we can further cross-filter based on the specific blueprint.
To delve deeper, we can view the deployments directly in the deployments table:
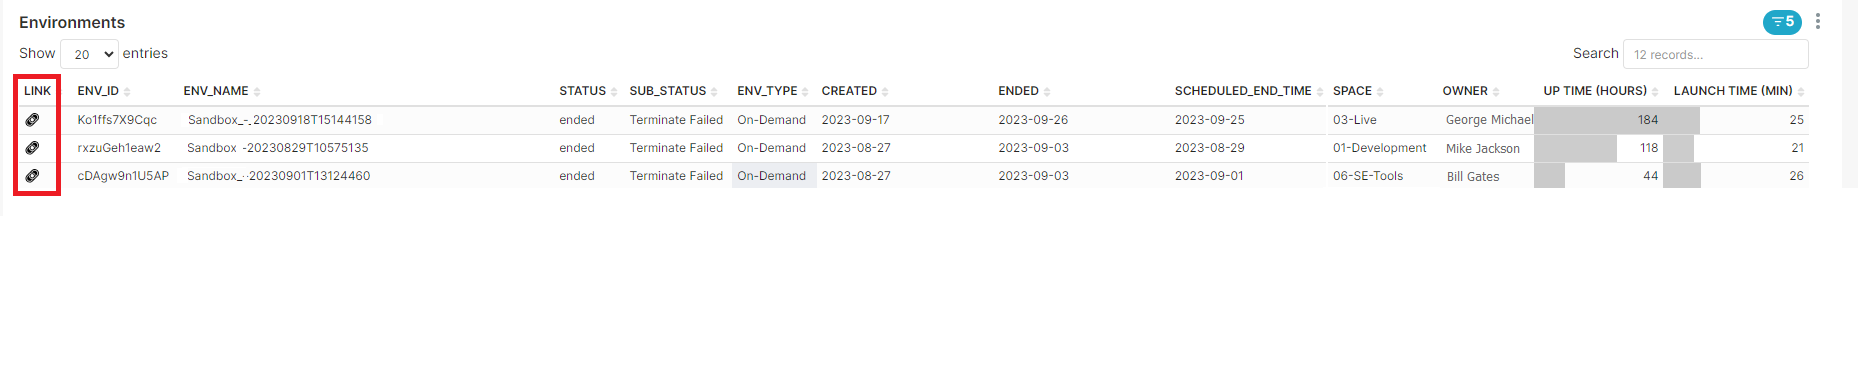
Clicking on the link will redirect us to the deployment page itself, facilitating analysis and decision-making regarding the next steps.